It’s like, how much more black could this be? And the answer is none. None more black.
– Nigel Tufnel, lead guitarist of Spinal Tap.
None more black (or none more white) is a real concern when you’re talking about imaging western blots. If you only want to verify the presence of a protein, you can stop reading here, because even an overexposed image will tell you that there is some protein present in your sample. But an overexposed image of a western blot is essentially useless when you’re trying to quantify the relative levels of protein in your various samples. Unfortunately, it’s still possible to analyze an overexposed blot image and think you’re getting meaningful results (you’re not). This might lead to you someday killing a patient, or even worse, having to retract a paper. Either way, no one wants that to happen. Let’s look at what overexposure means, how to tell when you’ve overexposed your western blot image, and what to do about it.
What is an over-exposed image?
Consider the image below (Figure 1). It shows a Stouffer Step Wedge, a tool used for calibrating photo exposures in the printing industry. The various bands go from essentially pure black on the left side to nearly pure white on the right side.
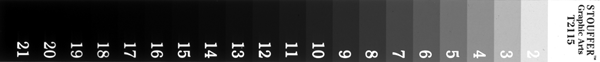
We’ll briefly use the Step Wedge as a stand-in for the protein bands on your western blot, and we’ll assume your image is in grayscale. The same basic concept applies if your CCD imager is returning colored image data (red bands, green bands, etc.). When you have a western blot image, your protein bands will fall somewhere within the range of brightness represented on the Step Wedge. On a CCD image capture, bands with lots of protein will be very bright, near white (or pure red or whatever color your imager is detecting). Old-school x-ray film works in the opposite way, so that on a piece of film, bands with lots of protein will be very dark, nearly black. If you open this image in a program like ImageJ, you can hover over the different steps and see how the reported gray value changes. For an 8-bit image, all of the steps from pure white to pure black are represented by a value between 0 and 255. The left end of the Step Wedge image, from roughly steps 21 to 16, will have grayscale values between 0 and 5, while the white section on the far right end should have a value of ~255. All of your western blot protein bands will have a grayscale value (also known as a density value) somewhere between 0 and 255. But if you have bands that are pure white, a value of 255 (from a CCD camera) or pure black, a value near 0 (if you’re still using film), you are going to run into trouble. The image below (Figure 2) shows the reported grayscale values for the Step Wedge image as reported by ImageJ, using either an 8-bit image (0-255), or a 16-bit image (0-65535). Many CCD imagers and film scanners can produce 16-bit images, which give finer gradations between the various density values, since you have 65535 brightness values instead of only 255.
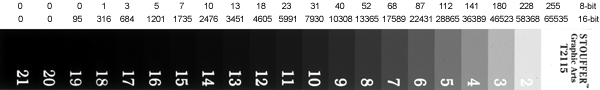
While the Stouffer Step Wedge does have slight gradations in blackness from steps 16-21 in real life, we can’t really see them on the digital image, and ImageJ reports the grayscale color on those steps as ~0-5 (on the 0-255 8-bit scale), which are essentially all the same level of blackness. This happened because the dynamic range of the scanner used to scan this image simply isn’t capable of capturing the full range of bright white and dark blacks all in one image. In order to properly expose the bright steps 1 and 2 so that you could still tell they were different (not both pure white), the scanner had to leave the darkest steps all at the same level of black. The same limitation exists with your CCD camera or x-ray film that you use to capture images of your western blots. If there are extremely bright bands on some parts of the blot, and very faint bands on other parts of the blot, your imager may not have the dynamic range to pick them all up in one exposure. The super-faint bands may fade into the background, or the super-bright bands may over-expose.
When you’re first capturing the image of your blot, you’re capturing light coming off of the blot due to the bound antibodies and luminescent reagents. Areas with more protein and bound antibodies produce more light. The CCD camera, or the film, captures this light and creates the image of your western blot. But if you leave the shutter open or the film exposed for a longer time, the blot continues to give off light, so much so that those bright portions of the image will overexpose the photosites on the CCD or the film.
Once a photosite (a pixel in your final digital image) is saturated with light, it simply can’t record whether any further light is still hitting it. And therein lies the problem. Your CCD camera will record an overexposed photosite (or pixel), as 255, pure white (or pure red, pure green, or whatever color it’s detecting). As photons continue to bombard that pixel, the value simply can’t go above 255, no matter how much longer you expose the image. To avoid overexposing the pixels, you need a shorter exposure time. (Substitute 65535 for 255 in the above paragraph if you have 16-bit images).
But a shorter exposure time runs the risk of missing very faint bands that are hard to pick out from the background (see Figure 3 below). Thus you’re faced with this struggle to find an exposure time that is long enough to allow the small amount of light from faint bands to be picked up, but isn’t so long that your brightest bands become overexposed.
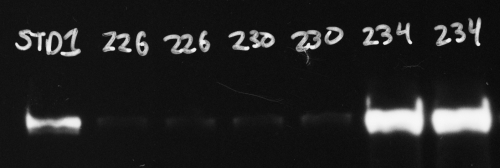
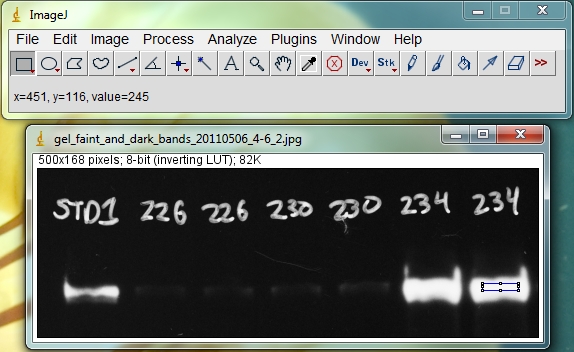
In the image above (Figure 3), which has been inverted from the original film scan, the duplicate sample bands labeled 226 and 230 are very faint, but the bands for sample 234 are very bright. This was a tricky blot to expose properly because of the very different amounts of protein that were present in the samples, and I had to err on the side of having very faint bands for 226 and 230 so that the very bright bands of 234 weren’t overexposed.
Consider what would happen to the image in Figure 3 if I lengthened the exposure time to try to get the faint bands to appear brighter. The bright bands of sample 234 would have soon saturated the film. But once that happens, I can’t know if those bands have 2 times as much protein as bands 226/230, or 5x as much, or 10x as much, simply because the film can’t absorb any more light, and those bands can’t get any brighter. So if I had lengthened the exposure time any further, I wouldn’t be able to tell how much protein was really present in sample 234 relative to my other samples. In reality, what I did was make several different exposures of this blot with several pieces of x-ray film while the luminescent reagent was working, starting at 10 seconds, 30 seconds, 1 minute, 2 minutes, and finally 5 minutes. After comparing my different images to check the exposure, I chose the 2 minute exposure shown above for the final analysis because sample 234 was not overexposed, and samples 226/230 were just bright enough to be picked up relative to the background.
Checking CCD image exposure
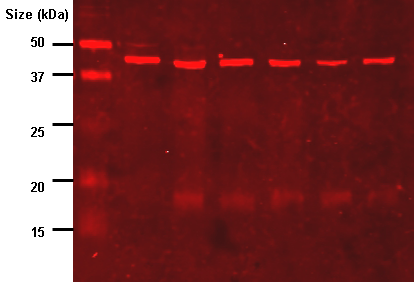
If you’re capturing images with a CCD gel scanner or similar device, it should be possible to quickly check the exposure on your bright bands. If your software has the facility, hover over the highly exposed bands and see what the grayscale values, or the red-green-blue (rgb) values are. Depending on the system, your gel scanner may be picking up primarily blue light, or primarily green light, or maybe some other color. What matters is that your brighest bands are not saturating (overexposing) that color channel. If your bands are coming back red, you don’t want the red channel to be up at 255 (or 65535 for 16-bit images). If your bands are green, you don’t want the green channel getting to 255 (or 65535 for 16-bit images). If for some reason your CCD camera doesn’t let you check for overexposed bands in the software, you can open the saved image in a program like ImageJ or Image Studio Lite, or even Photoshop. If you’ve spent enough money, your CCD imager may automatically take care of choosing the correct exposure for each blot, in which case you don’t need to be reading this article anyhow.
Let’s look at the red CCD image shown earlier. If you open this image in ImageJ and hover over one of the bright bands (the area inside the blue box on this image), ImageJ will show the red-green-blue values for the point you’re hovering over. The values are shown just below the menu bar. In this case the r-g-b values are 255, 022, 022. Because the red channel has a value of 255, this area is overexposed.
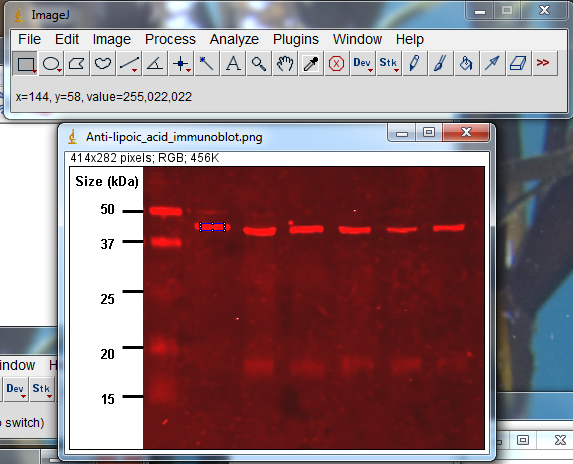
You might be tempted to still quantify protein densities an overexposed image like this by arguing that the fatter overexposed bands must have more protein that the thinner overexposed bands. While that statement is probably true in a general sense, it’s a hack move because you cannot accurately quantify just how much more protein is present in the fatter band, since you still can’t know how many photons were missed in the over-exposed photosites covering the band.
Checking film exposure
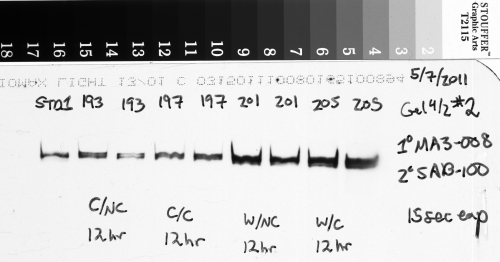
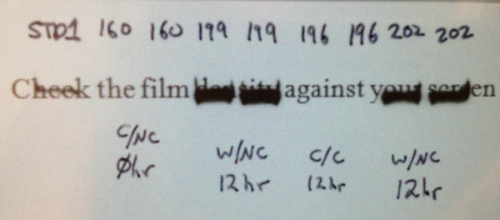
If you’re still imaging blots using x-ray film (let’s face it, it’s cheaper to buy some film and film developer chemicals and a scanner than it is to buy a full-fledged gel imaging CCD setup, particularly for a pilot project), you’ll need to make multiple exposures with the different exposure times I mentioned above, and develop all of those pieces of film. Once you have the developed film, you can find the best exposed piece that doesn’t have any overexposed bands. To easily check for overexposed (too black) bands, I like to just hold the film up over a line of text on my bright computer screen (Figure 5). If you can still just barely make out the text through the black part of your band (and I do mean just barely), the band is not overexposed. But if you can’t differentiate the white screen background from the black type, that part of the film was overexposed. It may be hard to tell in the image below, but I can just make out the letters behind each of the dark bands on this piece of film held up against my computer screen.
Once you’ve scanned the film into a digital image file, you can check the exposure in the same manner as the CCD image above by using a program like ImageJ or Image Studio Lite.
Hover your cursor over the brightest bands and look for the reported pixel values. In the image below (with the black and white colors inverted from the original film image), the region inside the blue rectangle on the last band has a reported value of 245, which is close to maxing out at 255. But a value of 245 leaves just enough headroom to not be overexposed.
Compared to a CCD imager, x-ray film has a more limited dynamic range, which means it can’t capture the same range of very faint and very bright bands in one single exposure as the CCD camera (see http://www.bio-rad.com/webroot/web/pdf/lsr/literature/Bulletin_5809.pdf for a comparison of the two technologies). If this is likely to be the case for your blot, you can compare data from two or more exposures that have some overlap. For instance, you might make one short exposure of a blot to avoid overexposing the brightest bands, but this will not show the faintest bands. As long as you can see your sample standard band (like the 1st lane in the image above, STD1), you can quantify your bright sample bands. Then you can follow this up with a 2nd piece of film that you expose on the blot for a longer time. In this case the bright bands will be overexposed and useless, but as long as your sample standards (again, lane 1, STD1 above) are not overexposed you can still quantify your faint bands. Since your quantification is always done relative to the sample standard(s), as long as you have properly exposed sample standards you should be able to cover a wider dynamic range of protein band brightness with two different exposures.
Pitfalls of overexposure during analysis
If you’re using ImageJ to analyze your western blots (see my tutorial here), you need to be careful to avoid using over-exposed images. ImageJ will happily produce an estimate of the density (brightness) of a band that is overexposed. But you have no way of knowing whether that number is accurate or wildly underestimating the protein density of the band. Thus you don’t have a reliable estimate of how much protein was present in that band. Every time you open a blot image in ImageJ, check the pixel values of your brightest bands. If they’re overexposed, choose a different image that was exposed for less time. If you don’t have multiple exposures of the same blot, you get to go back and strip the original blot and do the antibody probe all over again. That’s a bunch of extra work and cost, so you probably won’t make that mistake again.
If you’re using Image Studio Lite to analyze western blots (see my tutorial here), the software will warn you when you have overexposed bands. If you try to measure an overexposed band, Image Studio will return a value of Infinity, and you’ll be terribly frustrated. But at least you can’t get away with reporting bogus results for that band, because you simply won’t have any results to report. As above, go back and use one of your images with a shorter exposure time, or strip the antibodies and re-run the antibody probe again so that you can produce a properly exposed image.
If you’re using Photoshop to analyze your western blots, just stop it.