I’ve written previously about some example R scripts I created to extract sea surface temperature data from NOAA’s Optimum Interpolated Sea Surface Temperature products. If you want daily global sea surface temperatures on a 0.25×0.25° grid, they gather those into 1-year files available at http://www.esrl.noaa.gov/psd/data/gridded/data.noaa.oisst.v2.highres.html. If you want weekly average SST values on a 1×1° grid, you can get those back to 1981 at http://www.esrl.noaa.gov/psd/data/gridded/data.noaa.oisst.v2.html. If you just want a smaller file for a single day on the 0.25×0.25° grid, you can find those at http://www.ncdc.noaa.gov/sst/griddata.php.
The high-resolution daily data currently appear to use a mixture of NetCDF3 formats for 2013 and earlier, while the 2014 data are NetCDF4. The older files can be opened by David Pierce’s ncdf package, which is easily installed from CRAN on all platforms. The newer NetCDF4 files cannot be opened by the ncdf package, but David Pierce’s newer ncdf4 package will handle both older and newer file formats. That package should be available for OSX and Linux users directly from CRAN, but it is not available for Windows users directly. Instead, you can currently visit David Pierce’s ncdf/ncdf4 site where there are Windows-compatible versions of the package available. To install that .zip file, simply save it to your computer. Open an instance of Rgui.exe. Go to the menu item “Packages>Install package(s) from local zip file” and point R to your copy of the zip file. If that works, you should be able to call library(ncdf4) at the R command line and get access to all of the package’s functions. Fun! (Edit 2018: ncdf4 has been available on CRAN for some time now, so you should be able to just run install.packages('ncdf4') from the R command line now instead of downloading and installing the zip files)
With that caveat out of the way, I’ve created a new version of my R script called NOAA_OISST_ncdf4.R that contains three functions for extracting sets of SST data from the three types of OISST files (weekly, daily, single-day files), and a simple plotting function. The script is found at https://github.com/millerlp/Misc_R_scripts/blob/master/NOAA_OISST_ncdf4.R. Save that file into your R working directory as NOAA_OISST_ncdf4.R, then call source("NOAA_OISST_ncdf4.R") at the R command line to load up the four functions. The functions are
extractOISSTdaily()– extract gridded data from the high resolution files that contain daily SST values for a whole year that can be found at http://www.esrl.noaa.gov/psd/data/gridded/data.noaa.oisst.v2.highres.html.extractOISST1day()– extract gridded data from a single-day high resolution file that can be found at http://www.ncdc.noaa.gov/sst/griddata.php.extractOISSTweekly()– extract 1×1° gridded weekly mean SST values from one of the two big compilation files found at http://www.esrl.noaa.gov/psd/data/gridded/data.noaa.oisst.v2.html.plotOISST()– a basic plot of the output matrix from the other three functions.
In each of the extract functions, you supply a number of arguments:
fname– the path to the OISST NetCDF file (a .nc file).lsmask– the path to the land-sea mask file (a .nc file).lonW– the westernmost longitude of the area you want to extract (0 to 359).lonE– the easternmost longitude of the area you want to extract (0 to 359). This argument can be left out if you only want data from the grid longitude closest tolonW.latS– the southernmost latitude of the area you want to extract (-89.5 to 89.5)latN– the northernmost latitude of the area you want to extract (-89.5 to 89.5). This argument can be left out if you only want data from the grid latitude closest tolatS.date1– the starting date of the time period you want to extract. This should be a R date object or a string specified as “2014-11-25”. This argument isn’t used in the single-dayextractOISST1dayfunction.date2– the last date of the time period you want to extract. This should be a R date object or a string specified as “2014-11-25”. This argument is optional in the first two functions if you only want one day’s data. This argument isn’t used in the single-dayextractOISST1dayfunction.
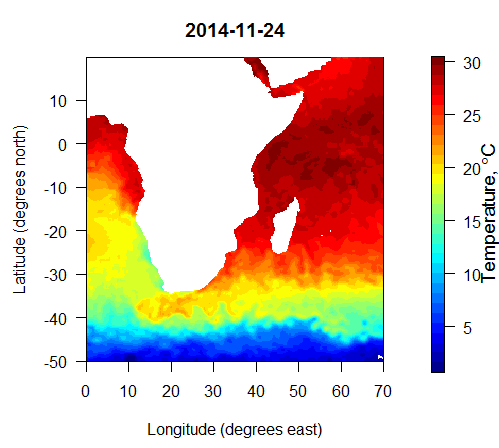
To extract the data used in the figure above, I first downloaded the 2014 high resolution daily file linked from http://www.esrl.noaa.gov/psd/data/gridded/data.noaa.oisst.v2.highres.html, along with the land-sea mask file lsmask.nc available directly on that page. The process in R was:
[code lang=”r”]
source("NOAA_OISST_ncdf4.R")
ssts = extractOISSTdaily("W:/NOAA_OISST/daily/sst.day.mean.2014.v2.nc","W:/NOAA_OISST/daily/lsmask.oisst.v2.nc",lonW=0,lonE=70,latS=-50,latN=20,date1=’2014-11-23′,date2=’2014-11-24′)
[/code]
That extracted 2 days of data. To plot the 2nd day’s data, I did the following:
[code lang=”r”]
plotOISST(ssts, 2)
[/code]
And that’s it.
As always, if you used the OISST data, it’s important to cite the group that produces it and makes it available. As they state on the site:
“This may be done by including text such as NOAA High Resolution SST data provided by the NOAA/OAR/ESRL PSD, Boulder, Colorado, USA, from their Web site at http://www.esrl.noaa.gov/psd/ in any documents or publications using these data.”
Or you can use the full-blown citations:
- Reynolds, Richard W., Thomas M. Smith, Chunying Liu, Dudley B. Chelton, Kenneth S. Casey, Michael G. Schlax, 2007: Daily High-Resolution-Blended Analyses for Sea Surface Temperature. J. Climate, 20, 5473-5496.
- Reynolds, R.W., N.A. Rayner, T.M. Smith, D.C. Stokes, and W. Wang, 2002: An improved in situ and satellite SST analysis for climate. J. Climate, 15, 1609-1625.