Edit: There is now a full-fledged R package, rtide, to accomplish the same basic task of generating time series of tide predictions that is outlined here. See this more recent post for information.
In the previous post I outlined how to query the XTide software with R and parse the results into a handy-dandy data frame. The biggest hurdle with that method is getting XTide up and running on your computer. The code outlined here works entirely within R, so you don’t need XTide installed on your computer. The trade-off is that it provides substantially less information. This script only produces tide height predictions at a user-specified interval (1 to 60 minutes), and doesn’t pick out high tide, low tide, sunrise, sunset, or any of the other fun stuff that XTide can produce. Additionally, this version only works for a subset of 637 of the NOAA tide stations rather than the 1000s of stations that XTide can output. The available stations are found on this page listed with the type ‘Ref’, rather than the ones labeled ‘Sub’. If all you want is a series of continuous tide height predictions for a NOAA reference tide station, this script and the associated Rdata file will do it for you. Fair warning: the actual prediction routine is not vectorized, so if you ask for many weeks of high-frequency data, the script will take a few minutes to run.
The script tide_prediction.R and the harmonics file Harmonics-20120302.Rdata can be found in my GitHub repository. The tide_prediction.R script is shown below.
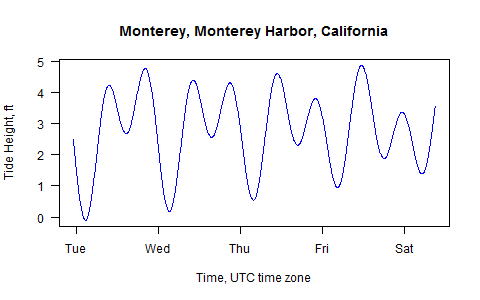
# Filename: tide_prediction.R

# NOT FOR NAVIGATIONAL USE. DON'T WRECK YOUR BOAT BASED ON MY BAD CODING.
# Generate tide height predictions for US NOAA *reference* tide stations
# entirely within R.
# This requires a previously-produced file of harmonics for the sites, stored as
# a Rdata file. The current file is Harmonics-20120302.Rdata. The harmonics file
# was originally derived from XTide, found at http://www.flaterco.com/xtide/
# The available reference tide stations are listed here:
# http://www.flaterco.com/xtide/locations.html
# Note that only stations listed as type 'Ref' on that page can be used
# with this script.
# The script assumes that all input times (and corresponding tide
# time outputs) are in UTC/GMT time zone, not your local time zone. Check the
# output against NOAA's tide predictions at
# http://tidesandcurrents.noaa.gov/tide_predictions.shtml
# This can produce predictions for years between 1700 and 2100, but with
# decreasing accuracy as you move further from 2012 (say beyond 1990 or 2030)
# since the harmonics file is derived from the current tidal epoch, and things
# like sea level have a tendency to change over time.

# This script may take a few minutes to run if you ask for weeks of
# high-frequency tide predictions.
# The output is stored in a data frame called 'results'.

# Author: Luke Miller May 19, 2013
###############################################################################
# Sys.setenv(TZ='UTC') # Change R session time zone to UTC (optional)

# User-friendly version for loading harmonics Rdata file:
cat('Please load the harmonics Rdata file.\n')
load(file.choose())

# Hard-coded version, if your harmonics file is always in the same place:
#load('D:/R/Weather_data/Harmonics_20120302.Rdata')

# Specify tide station, Site names: http://www.flaterco.com/xtide/locations.html
# Only the stations labeled 'Ref' will work with this script.
cat('Please enter the station name: \n')
stationID = scan(file = '', character(), quiet = TRUE, n = 1, sep = '#')
# Hard-coded version:
#stationID = 'Monterey Harbor'
#stationID = 'Boston, Boston Harbor'
#stationID = 'San Diego, San Diego Bay'
#stationID = 'Boston'

# Find row index of the desired station in the harms list that was loaded from
# the harmonics Rdata file.
stInd = grep(stationID, harms$station)

# If no stations are found, or multiple possible stations are found, notify the
# user.
if (length(stInd) == 0){
cat('No station found.\n')
} else if (length(stInd) > 1) {
cat('Multiple stations found, please choose one (enter number): \n')
for (i in 1:length(stInd)) {
cat('[', i, ']', harms$station[stInd[i]],'\n')
}
choice = scan(file = '', what = numeric(), n = 1, quiet = TRUE)
stInd = stInd[choice]
}

# Show the name of the station being used
cat('Using station: ', harms$station[stInd],'\n')

# Specify number of minutes between tide predictions
cat('Enter desired frequency of predictions in minutes (1-60): \n')
freq = scan(file = '', numeric(), quiet = TRUE, n = 1)
#freq = 6 # units of minutes, hard coded version

freq = freq * 60 # convert minutes to seconds

# Specify start and end times for the tide predictions
# If you cross a year boundary, the predictions must use the
# correct equilibrium and nodefactors for each year.
cat('Enter starting time (YYYY-MM-DD HH:MM) in UTC/GMT time zone: \n')
t1 = scan(file = '', character(), quiet = TRUE, n = 1)
cat('Enter ending time (YYYY-MM-DD HH:MM) in UTC/GMT time zone: \n')
t2 = scan(file = '', character(), quiet = TRUE, n = 1)
# Hard coded version:
#t1 = '2012-12-31 23:00'
#t2 = '2013-01-01 09:00'

# Convert to POSIXct time format, with UTC time zone
t1 = as.POSIXct(t1, tz = 'UTC')
t2 = as.POSIXct(t2, tz = 'UTC')

# Create data frame with sequence of times at desired frequency
times = data.frame(POStime = seq(t1,t2,freq))
# Extract the year for each of those time points
times$yr = as.POSIXlt(times$POStime)$year + 1900
# Use the year to make a character value representing the start of the year
times$yrstart = paste(times$yr, '01', '01', sep = '-')
# Calculate hours since the start of the year for each time point
times$hours = as.numeric(difftime(times$POStime,
as.POSIXct(times$yrstart, tz = 'UTC'), units = 'hours'))
# Make a year index to pull correct starting values from harms for the year
times$yrindx = times$yr - harms$startyear + 1

########################################
# Tide height calculation - Magic happens here
# Input times behave as if they are given in UTC, so output tides correspond to
# the UTC times.
pred = vector('numeric',nrow(times))
pred[1:nrow(times)] = harms$datum[stInd]
for (j in 1:nrow(times)) {
for (i in 1:length(harms$name)) {
pred[j] = pred[j] + ((harms$nodefactor[i,times$yrindx[j]] *
t(harms$A[stInd,i]) *
(cos((harms$speed[i] *
times$hours[j] +
harms$equilarg[i, times$yrindx[j]] -
t(harms$kappa[stInd,i])) *
pi/180))))
}
}
# Finished tide height calculations, units of feet (sorry, that's the way it is)
####################################

timesout = as.POSIXct(times$hours * 3600, origin = times$yrstart, tz = 'UTC')

# Make an output data frame
results = data.frame(TimeUTC = timesout, TideHt.ft = pred)

# This will produce a column of times in the current R session's time zone,
# which isn't necessarily the time zone of your tide station.
results$TimeLocal = c(results$TimeUTC)

cat('Finished. See "results" data frame for output.\n')
# Optionally print the results
plot(results$TimeUTC,results$TideHt.ft, type = 'l', col = 'blue', las = 1,
xlab = 'Time, UTC time zone', ylab = 'Tide Height, ft',
main = harms$station[stInd])
In addition to these tide prediction routines, I have also previously provided R scripts to query the NOAA servers to retrieve measured, verified historical tide height data. That process is shown in this older post.