Joe Thorley at Poisson Consulting has released a new R package, rtide, (on which I am listed as a co-author) that provides the ability to predict future (and past) tide heights for 637 different tide stations in the United States and associated territories. The underlying data, consisting of tide harmonic constituents, are collected and released by the National Oceanic and Atmospheric Administration. The author of the definitive open source tide prediction software, XTide, collates those harmonic data into a usable format, and we have harvested the data to create the rtide package which operates in R without the need to have XTide installed.
You can install and load the rtide package by simply running the following commands at your R console:
install.packages('rtide') # run this one time to install the package on your computer
library(rtide) # use this command to load the package whenever you start a new R session
To generate a set of tide height predictions, use a command like the following:
dat = tide_height('Monterey Harbor',from = as.Date('2016-09-05'),
		to = as.Date('2016-09-07'), minutes = 10, tz ='PST8PDT')
The results in dat will be a 3-column ‘tibble’ (essentially a data frame) consisting of the
station name (Monterey Harbor), the DateTime column (which should be in the given time zone, which we specified as Pacific Daylight Time), and TideHeight, which is in units of meters. The time step between estimates is declared by the minutes argument, and we set it to 10 minutes above.
head(dat)  # show some of the resulting data

# A tibble: 6 x 3
                                Station            DateTime TideHeight
                                  <chr>              <time>      <dbl>
1 Monterey, Monterey Harbor, California 2016-09-05 00:00:00   1.207174
2 Monterey, Monterey Harbor, California 2016-09-05 00:10:00   1.230523
3 Monterey, Monterey Harbor, California 2016-09-05 00:20:00   1.251265
4 Monterey, Monterey Harbor, California 2016-09-05 00:30:00   1.269248
5 Monterey, Monterey Harbor, California 2016-09-05 00:40:00   1.284345
6 Monterey, Monterey Harbor, California 2016-09-05 00:50:00   1.296448
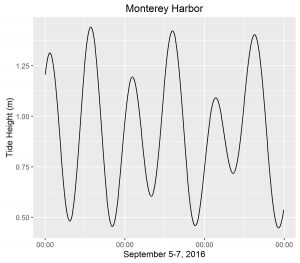
You could then use these predicted tide heights for any number of things, such as figuring out when your field site might be exposed or underwater at a given time, or making pretty plots of the tide cycle at your favorite location. The plot above was generated using the example data produced here and the code below:
library(ggplot2)
library(scales) # for the date_format function

ggplot(data = dat, aes(x = DateTime, y = TideHeight)) +
		geom_line() +
		scale_x_datetime(name = "September 5-7, 2016",
				labels = date_format("%H:%M", tz="PST8PDT")) +
		scale_y_continuous(name = "Tide Height (m)") +
		ggtitle("Monterey Harbor")
The available sites for tide prediction can be found by calling the tide_stations() function. If you’re concerned about the accuracy of the predictions, you can always double-check them against the official NOAA tide predictions available on the http://tidesandcurrents.noaa.gov/ website.
Some folks will be wondering whether rtide can produce predictions for other locations around the world (for instance, Canada). At the present time there is no facility to predict the tides for other countries, primarily because other countries do not release their tidal harmonic data into the public domain like the US does. Hopefully this will be rectified in the future via legislative action (don’t hold your breath), but for the present time we are limited to providing predictions for the US.