Following on this earlier post concerning the retrieval of data from figures in published papers with R, here is a method for doing the same with ImageJ. This is a freely available program that should run on Windows/Mac/Linux, just like R. To extract data points from a figure, you’ll need the Figure_Calibration plugin developed by Frederic V. Hessman, available here. Download the Figure_Calibration.class file from that page and save it to your ImageJ/plugins/ directory. Then load up ImageJ.

You’ll need a good scan of the figure to begin with, saved as a jpg, png, tiff or bmp. Most importantly, the figure needs to be straight so that the x-axis is horizontal and the y-axis is vertical. If your figure is not perfectly level, you can rotate it by going to ImageJ’s menu item Image>Rotate>Arbitrarily to tweak the figure. Once the figure is level, follow the directions below.
The first step is to tell ImageJ what the scales of the x and y axes are. This is accomplished by using the rectangle tool to draw a rectangle on the figure between known points (tick marks on the axes).
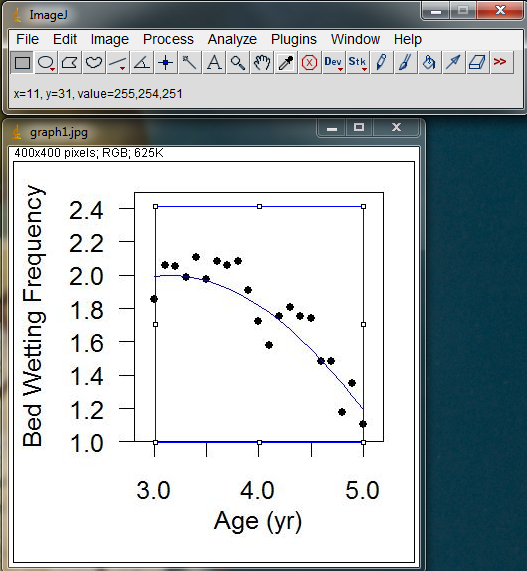
In the image above, my blue box starts at x = 3.0 , y = 1.0 and extends up to x = 5.0, y = 2.4.
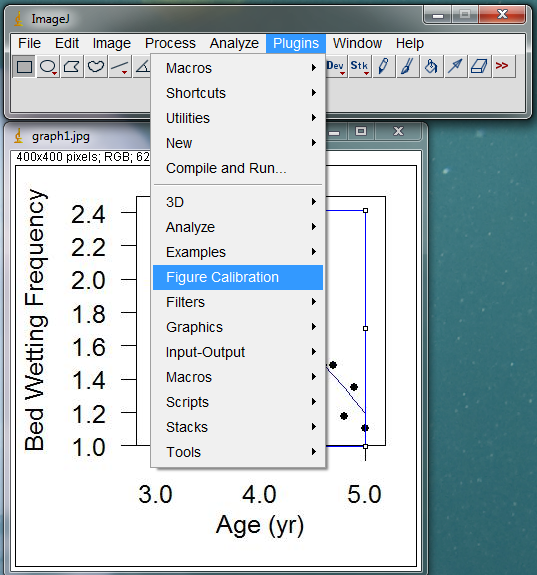
Next go to Plugins>Figure Calibration to activate the Figure Calibration plugin. This will open a window next to your image.
In the Figure Calibration window, enter the x,y values for the corners of your rectangle, based on the tick-mark values on the original figure. In the image below, I’ve inserted the x and y values for the corners of my box.
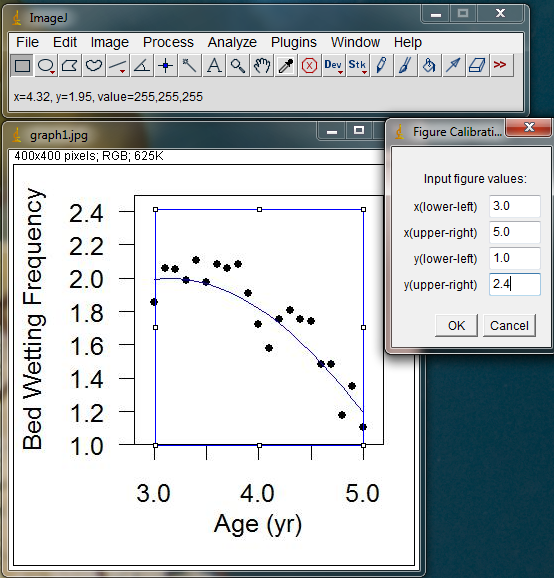
Hit OK in the Figure Calibration window when you’ve entered the calibration values. Now ImageJ will report x,y locations on the image based on your calibrated coordinate system. These new measurements should be reflected in the x,y values shown as you move the cursor around the image.
To begin measuring the actual data points on the figure, switch to the Point selection tool or the Multi-Point selections tool (right click on the Point selection tool to get the multi-point tool. Thanks to Ty Matthews for pointing out this new feature). With the Multi-Point selection tool, you can click on each point on your graph, and a dot will be left behind. If you misplace a point slightly, hover over the dot with the Multi-Point selection tool and it will turn into a hand icon, allowing you to reposition that dot. When you have finished placing dots on all of the points in your figure, hit “m” or Ctrl+m to measure the x,y location of each dot you placed. A Results window should appear with your x and y coordinates, along with any other measurements you currently have enabled (Mean, Slice etc).

If you accidentally click in the wrong spot and take a measurement, you can clear that measurement from the Results window by highlighting that row, then choosing Edit>Clear in the Results window menus. After selecting all 20 points on my example graph, I got the following results:
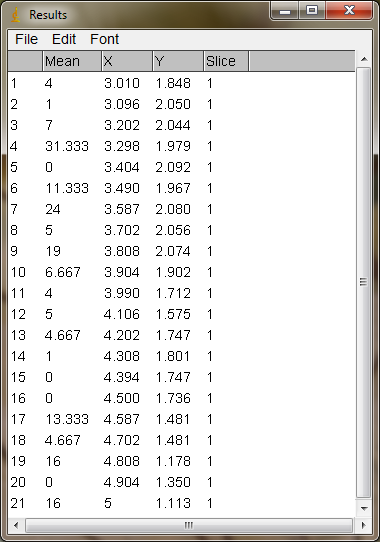
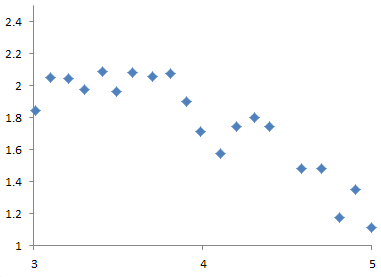
The data in the Results window can be copied and pasted into a program like Excel by clicking on Edit>Select All in the Results menu, then hitting Edit>Copy to copy all of the data. Paste the numbers into your spreadsheet program as normal. You can also Save As a .xls file in the Results File menu. I saved these numbers in Excel and produced the figure below, which mirrors the original figure well.
Edit: You might also find this web-based plot digitizer developed by Ankit Rohatgi to be useful: http://arohatgi.info/WebPlotDigitizer/ This program runs inside of your Firefox or Chrome web-browser. Simply drag your plot image onto the application webpage and begin digitizing points. There are helpful tutorials provided as well.