OWHL – The Open Wave Height Logger
OWHL is a project originally dreamed up by Jarrett Byrnes and Ted Lyman at UMass Boston. Early on they contacted me for my thoughts on how to accomplish the goal of making a cheap, long-life pressure sensor data logger that could be used to record ocean wave heights near shore. I joined the effort during the initial specification stages. Ideally this device could be mounted on the seafloor at ~10 meters depth offshore, and record surface waves at 4 Hz for many months, with data saved to a micro SD card in a text format (csv) that can be easily read by any user. We hope all this could cost less than $100 per logger so that many units can be deployed along the shore to characterize the wave climate at a finer spatial scale than is currently available.

The design is centered around an AVR 328P microcontroller (the same unit used in a standard Arduino development board) and a Measurement Specialties MS5803 pressure transducer, and was programmed in the Arduino open-source development environment.
Basic design – the important parts
- AVR ATmega 328P microcontroller
- MS5803-14BA pressure transducer, I2C communications, built-in temperature sensor
- Micro SD card for storing data
- DS3231 Real Time Clock, which provides a battery-backed temperature-compensated clock
Other bits
- Status LEDs
- Piezo buzzer and magnetic reed switch, so the user can check whether the unit is alive and logging data underwater without having to open the housing.
- 3.0V voltage regulator for use with 3x Alkaline cells. Could optionally run without a voltage regulator on 3.6V Lithium cells.
- Extra AVR pins exposed for future uses (external temperature sensor?).
Since memory space isn’t really a limiting factor anymore with the availability of multi-gigabyte SD cards, the major challenge for this project, after writing a library to talk to the MS5803 pressure sensor (see the GitHub repository here), was to make the OWHL power-efficient so that it could run for months or maybe a year on a set of D cell alkaline batteries, even while sampling 4 times a second. Jarrett would like to deploy these year-around along the northeast Atlantic coast, and obviously he doesn’t want to have to get in the water between November and May just to service these things. To that end, I designed the OWHL to spend most of its time in a low power sleep state in between taking pressure samples every quarter second. If you read through the code posted on the GitHub OWHL repository, you’ll see that most of the space is devoted to going into sleep mode and coming out of sleep mode, and doing all the housekeeping (turning peripherals on and off) that comes with that process.
The workflow for the software is as follows:
During the setup loop, the DS3231 real time clock is checked to see whether it’s already running and whether its time value jives with the compile time of the program. If the clock is behind, it gets reset to whatever time the program was compiled, so you set the clock simply by uploading the program the first time.
Next the SD card communications are initiated. This uses the SPI serial protocol and makes use of the SdFat library. A new file is opened, and named with the date, in the format YYMMDDXX.CSV, where YY = 2-digit year, MM and DD are the month and day, and XX is a simple counter from 00 to 99 if more than one file is generated per day.
The program is set up to allow you to only sample for a portion of every hour, or to sample continuously. At the top of the file, there are two #define statements for STARTMINUTE and DATADURATION, which by default would be set to 0 and 60, which specifies that datalogging should begin on the 0 minute, and continue for 60 minutes, effectively giving continuous datalogging. A value of 0 and 30 would start logging on the 00:00 minute mark of each hour, but only record 30 minutes of data before going to deep sleep for the remainder of the hour (saving memory and battery). The end of the setup() process in the program deals with these values and decides whether the program should launch into datalogging mode or deep sleep when it finishes setup and transitions to the main loop() loop.
In the main loop, there are two major branches. If it’s time to log data, we do one thing, and if it’s time to stop logging data (for the remainder of the hour), we do another thing. When logging data, the program activates the 328P’s TIMER2, which can be clocked from an external clock source, usually a 32.768 kHz clock signal. Conveniently, the DS3231 Real Time Clock can be set to output a 32.768 kHz signal, which is hooked to XTAL1 input on the 328P. By doing this, the AVR 328P can be put to sleep (SLEEP_MODE_PWR_SAVE) and awoken whenever TIMER2 rolls over. We set TIMER2 to roll over every 0.25 seconds when fed a 32.768 kHz clock signal. As a result, the datalogger wakes up every quarter second, and in the main loop it takes a sample from the MS5803 pressure sensor, and stores the pressure and temperature values in a temporary array before going back to sleep. Because the clock signal is coming from the real time clock, we can be fairly sure that the time points will be accurately spaced, rather than relying on the less-accurate internal clock signal of the 328P. After the 4th data point per second is collected, the collection of values for that second is written to the microSD card, and once again the datalogger returns to low-power sleep mode. Most of the read and write operations can happen in less than 20-40 milliseconds, after which the datalogger is asleep for the rest of the 250 milliseconds that makes up each quarter second. On the human time scale all of this sleeping is happening way too fast to be noticed, but if you can sleep for roughly 80% of every second of every day, it adds up to a lot of low-power sleep time.
If the user chooses to only log data for a portion of every hour (I’d recommend 30 minutes), once datalogging has ceased for the hour the unit goes into an even lower-power sleep mode, SLEEP_MODE_PWR_DOWN, that saves more power than the other sleep modes. In this mode, TIMER2 can no longer awaken the 328P, so instead we turn to the 328P’s internal watchdog timer, which we set to wake up every 8 seconds. This timer isn’t terribly accurate on the millisecond to second scale, but it saves quite a bit of power. As such, every time the watchdog timer wakes the 328P, the program quickly checks the real time clock’s time value, and decides whether it’s nearly time to start logging data again. If it is, then the program returns to the higher power SLEEP_MODE_PWR_SAVE that is clocked by the real time clock.
Currently, I have designed in a magnetic reed switch on interrupt INT1. If the user actuates this switch by waving a magnet near the circuit board, it activates a heartbeat function that beeps a piezo buzzer in between data samples to let the user know the logger is alive. The goal of this portion of the code was to shut down all of the external signaling equipment (LEDs and the buzzer) to save power during the majority of the time when the unit is sampling. If a diver is only going to check on the datalogger every few months, there’s no point in flashing a status LED constantly that only the fish will see.
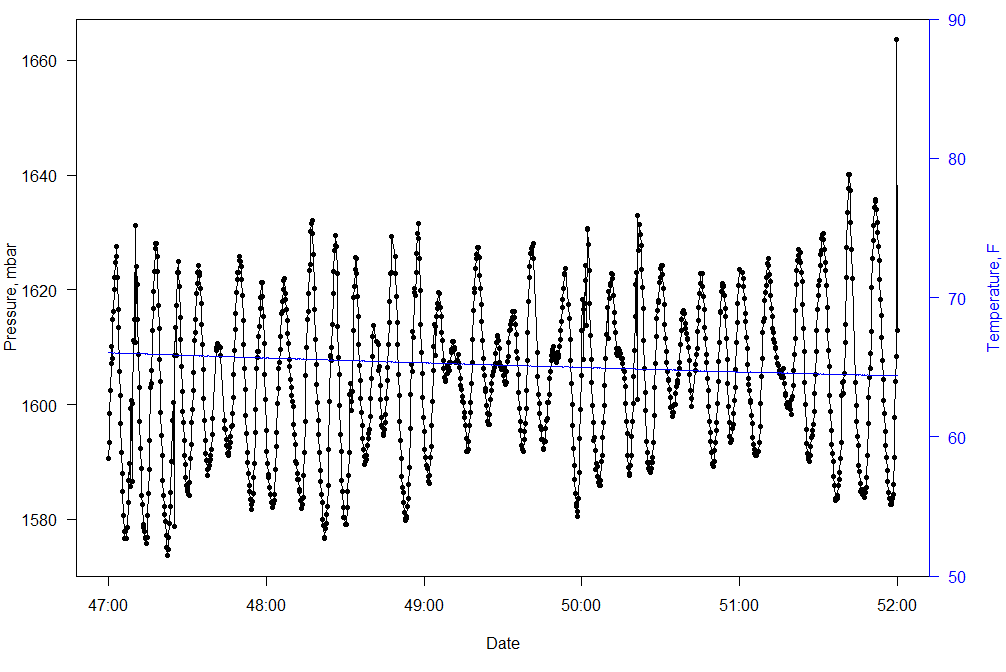
The program starts a new output file at midnight every day, and assigns it a new name based on the year-month-day. The output files are organized as comma-separated-values (CSV) files that can be directly opened with all sorts of software including Microsoft Excel. The columns in the file are arranged as
POSIXt. This is the elapsed seconds since midnight 1970-01-01, i.e. standard “unix time”. There is no time zone associated with this value, it is whatever time zone the real time clock was set to, which is based on the time that the computer used to compile the program was set to at compile time. This value recognizes leap days, but does not change for daylight savings time. Ideally your real time clock should always be set to standard time (not daylight savings time), and even more ideally (is there such a thing?) you would set it to UTC (aka Greenwich Mean Time).DateTime. This is a human-readable version of the POSIXt value, again in whatever time zone the real time clock was set to.frac.seconds. When sampling at 4 Hz, there will be 4 samples taken per second, at the 0, 0.25, 0.50, and 0.75 second time points. This column lists those values, which can be appended to the full time value in whichever software program you’re using to process the data.Pressure.mbar. The recorded pressure value from the MS5803, in millibar.TempC. The temperature recorded from the MS5803, in degrees Celsius.
Physical design
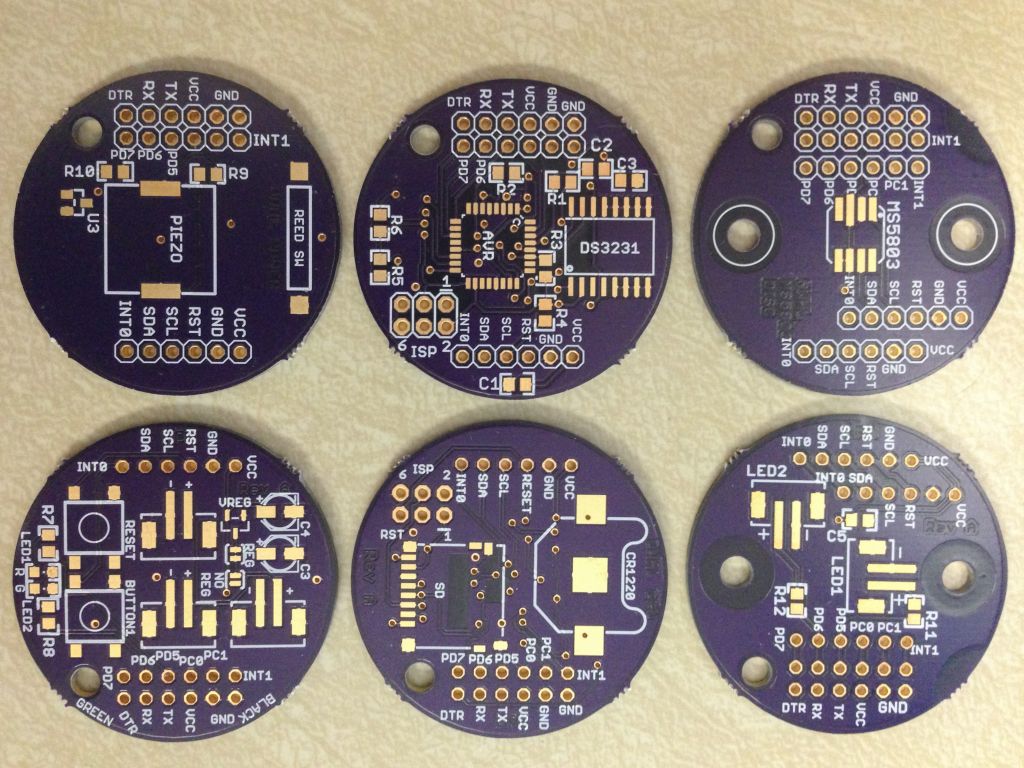
After laying the original design out on a breadboard and prototyping boards, the first “real” PCB design (revision A) is a stack of 3 round PCB’s 1.5″ in diameter. I borrowed this concept from Anton Staaf’s earlier wavelogger project that was designed to measure wave impact forces in the intertidal for Mark Denny’s Biomechanics Lab at Stanford University’s Hopkins Marine Station. The three boards of the OWHL are designed as follows:
- The MS5803 board. This board holds the MS5803 pressure sensor dead center on its top side. The sensor is meant to mate to a o-ring sitting inside a pressure port that opens to the outside of the housing. The board has two holes sized for 6-32 screws placed 0.5 inches above and below the MS5803 (= 1″ between the holes) to help hold the board and sensor tight against the o-ring. On the backside there is a single 0.1 uF capacitor to help stabilize voltage supply to the MS5803. The bottom of the board also holds the three six-pin female headers that mate to the next board in the stack.
- The CPU board. The top side of this board holds the AVR ATmega 328P, the DS3231 real time clock, and several pull-up resistors and 0.1 uF capacitors. The bottom side mounts the micro SD card slot and a CR1220 battery holder, which provides backup power to the DS3231 clock so you can disconnect the main battery and not lose the time. There are three 6-pin headers again, but these use “wire-wrap” style female headers, which have long pins that stick up through the top side of the board, and mate with the female headers on the MS5803 board. There is also a 3×2 header pin used for In-System Programming of the 328P when it is first installed. This ISP header allows you to burn a bootloader program onto the AVR (just like normal Arduinos), after which you can put new programs on the AVR using the serial communications (see below). The 328P is set up to use its internal oscillator running at 8MHz so that we can free up the external crystal oscillator pins (XTAL1) to take in the 32.768kHz signal from the real time clock that triggers the interrupt on
TIMER2. - The Power board. The top side of this board holds the magnetic reed switch, piezo buzzer, and a NPN transistor to supply power to the buzzer, plus two current limiting 1k ohm resistors. The bottom side holds two status LEDs (red and green) and current-limiting 510 ohm resistors, JST power connector(s) for the battery, the 3.0V MCP1700 voltage regulator, 1uF electrolytic capacitors for the regulator, and two pushbuttons. Again, this board uses the wire-wrap style long-tailed 6-pin headers, with the long pins sticking up through the top of the board to mate with the bottom of the CPU board.

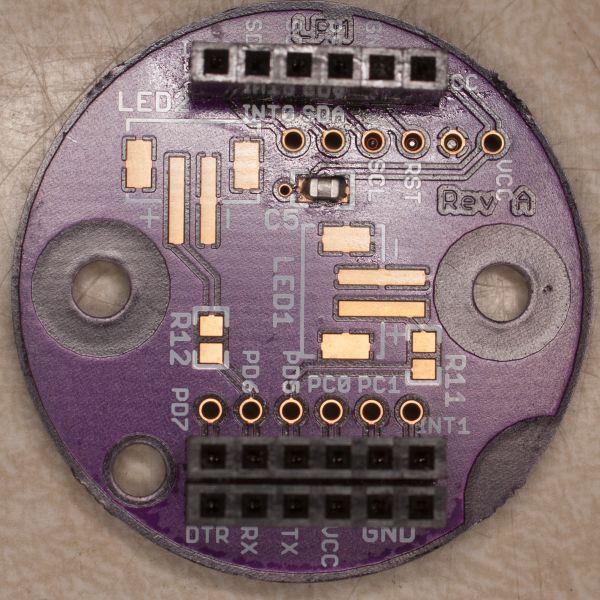


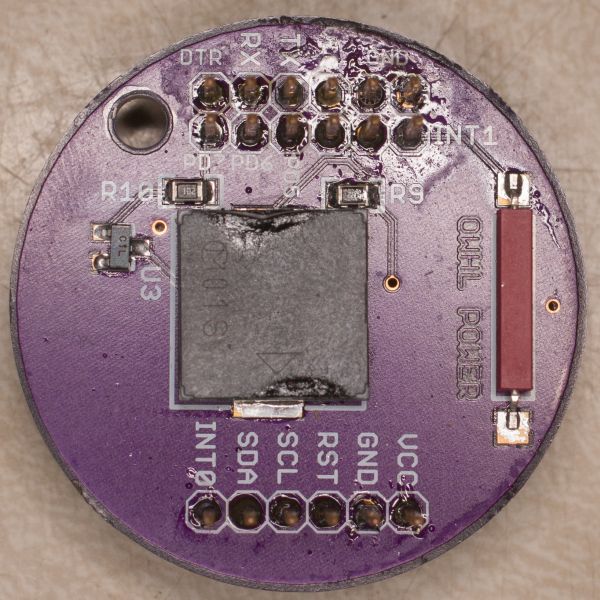

On the bottom of the Power board, the outer 6-pin header on the side with 2 headers is set up to mate with a FTDI UART-to-USB converter chip like Adafruit’s FTDI Friend. Using this header, you can power the whole stack (with 3.3V only, never 5 volts, since this input is not regulated by the board and the sensor + SD card would be unhappy with 5 volts!) and program the AVR 328P after you’ve burned a bootloader on to the 328P the first time with the ISP header on the CPU board. Since this header should be accessible when the stack is mounted inside a housing, programming over the serial connection with a FTDI Friend is the preferred method.

One of the buttons on the bottom of the Power board is the RESET button for the AVR, which reboots the microcontroller. The second button is hooked to the AVR’s interrupt INT0. Currently I have this programmed to stop all logging and put the unit into a permanent sleep mode until it is fully rebooted, but this could be repurposed for other functions.
The housing
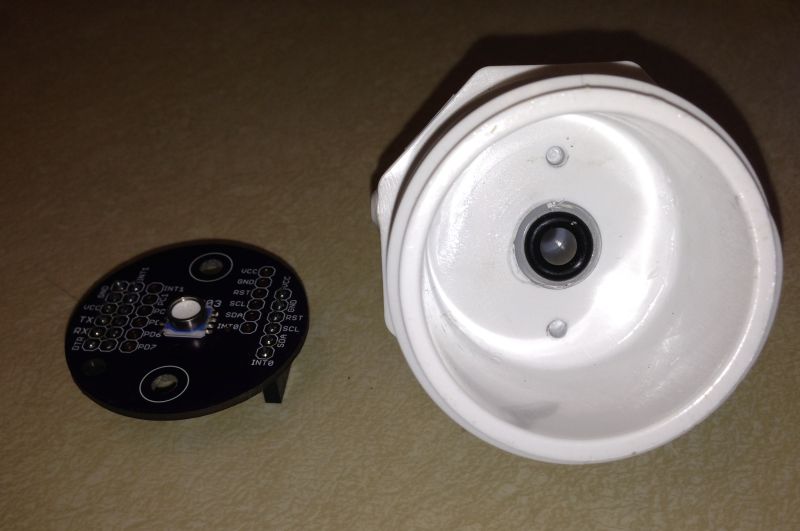
At present, the housing design is in flux. Ted has gone through a few iterations for the prototypes so far.
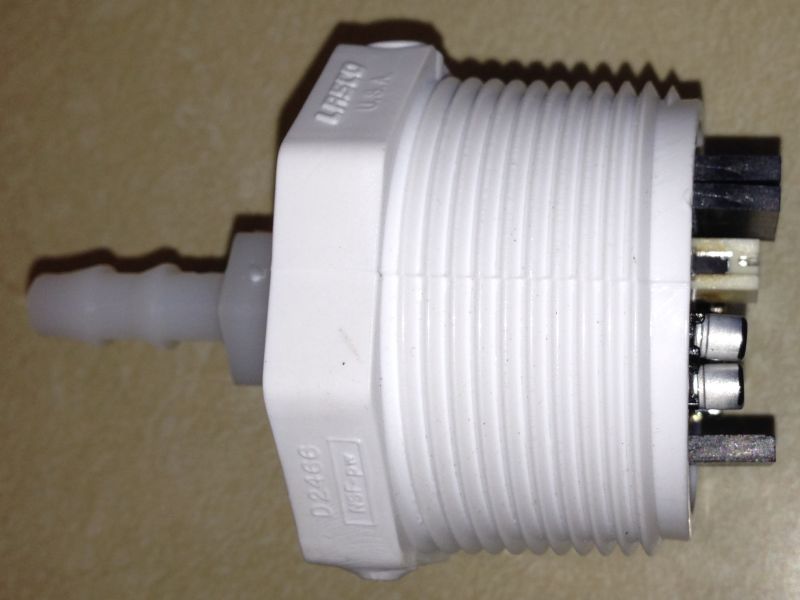
The MS5803 fits a 5.6mm ID x 2.4mm cross section o-ring around its stainless steel ring. A size X drill bit (0.397″, 10.08mm diameter) will create a nicely-sized recess to fit that o-ring, so we have used this approach to machine a recess into the end of the threads of a 1/4″ NPT barbed fitting. The goal is to isolate the MS5803 from the seawater to avoid having animals (barnacles particularly) settle onto the MS5803 and occlude its pressure port. With the MS5803 mounted to the barbed fitting, we add a length of silicone tubing to the barb, fill it with oil, and cap the tubing. In this way, the outside seawater pressure is transferred through the oil to the pressure port. This increases the overall surface area of the pressure sensor, which will hopefully allow for it to keep working even as animals inevitably settle on the tubing and everywhere else on the housing. This approach will usually end up creating a pressure offset when filling the flexible tubing with oil and capping it off, but it should be trivial to factor out the offset. In theory you could run the MS5803 pressure port directly exposed to seawater, but fouling organisms are a fact of life that have to be accounted for. We have used this approach for the initial prototypes with some success.
Where the project currently stands
As of summer 2014, we have carried out a few overnight deployments in the field. The prototype PCB stack is being tested to see how the power consumption and longer-term datalogging performs. Undoubtedly there will be some improvements that can be made to lower the power consumption a bit. It may be desirable to add a separate temperature sensor, because the internal sensor on the MS5803 is slow to respond. A final design for a housing is also needed. Lastly, we need to develop a workflow for post-processing the data once the SD card is downloaded.
![]()