It’s construction time in the laboratory again. This time we’re building shell gape sensors for oysters, based on a datalogger design derived from the MusselTracker datalogger I designed a few years back.
In this new design, we can have up to 16 gape sensors attached to one datalogger, though we’ll just have 10 to start with right now. These will be deployed on a mooring inside an estuary, so they will primarily need to be protected from a bit of wave splash and rain. But they’ll be built with the same kind of robust pieces that hold up to breaking waves on the rocky seashore, because why not?
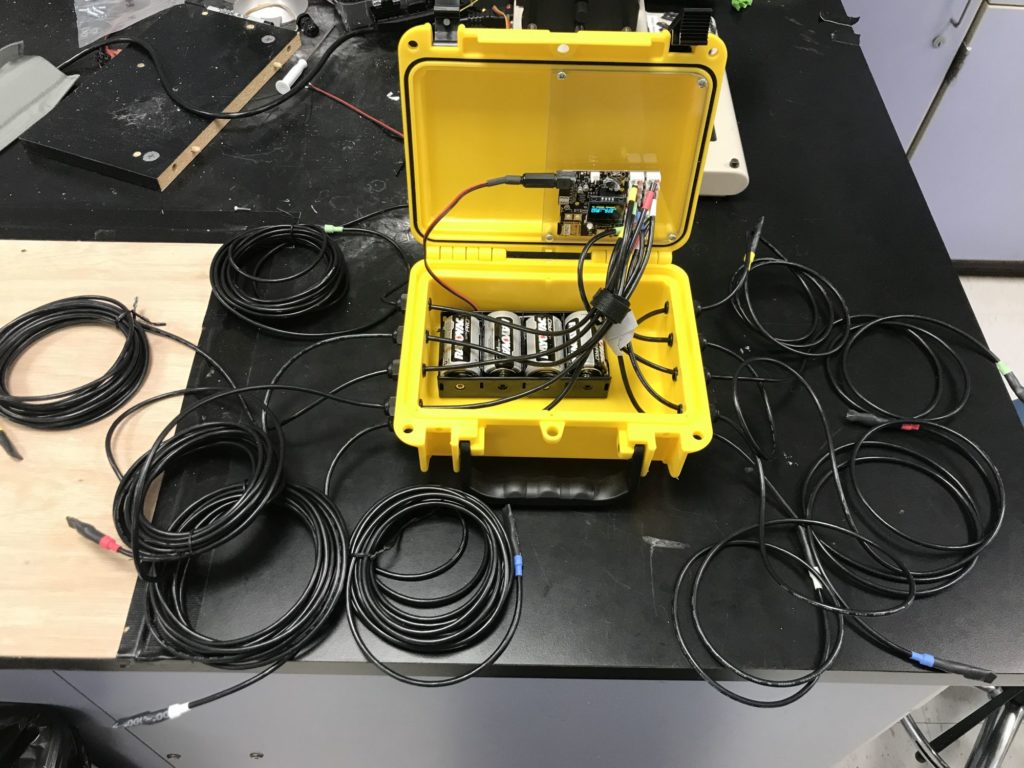
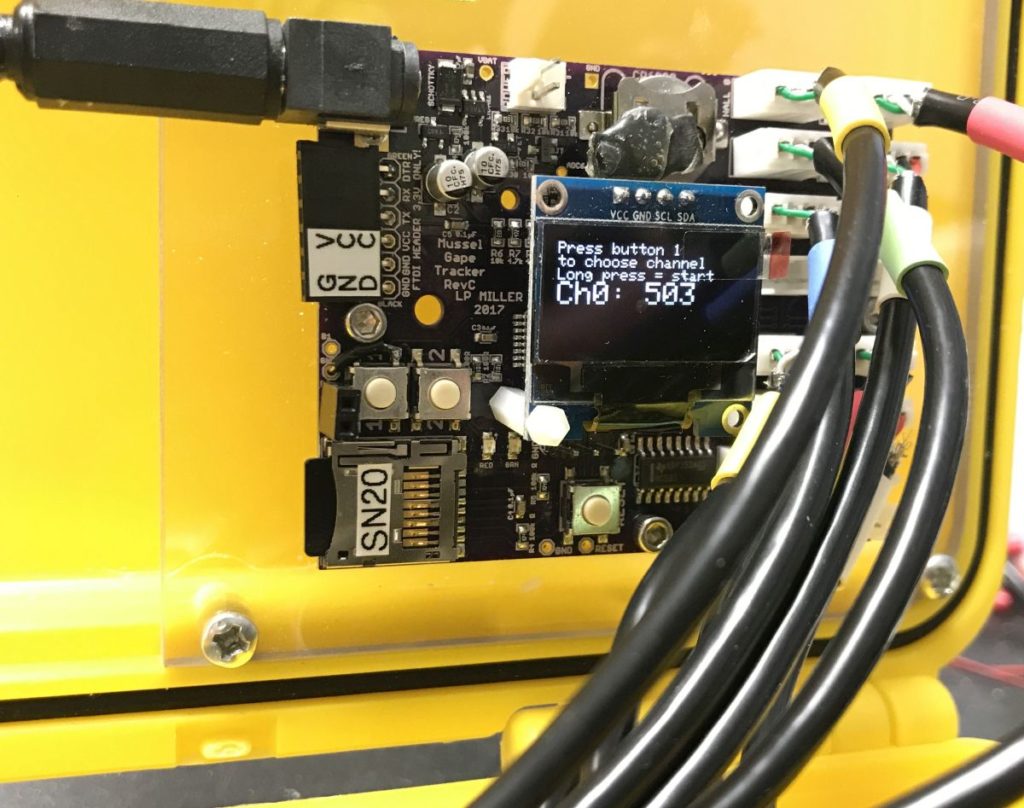
We start with a perfectly good watertight box (Seahorse Products SE-120 in this case), and drill it full of holes, making it much less watertight, at least temporarily.
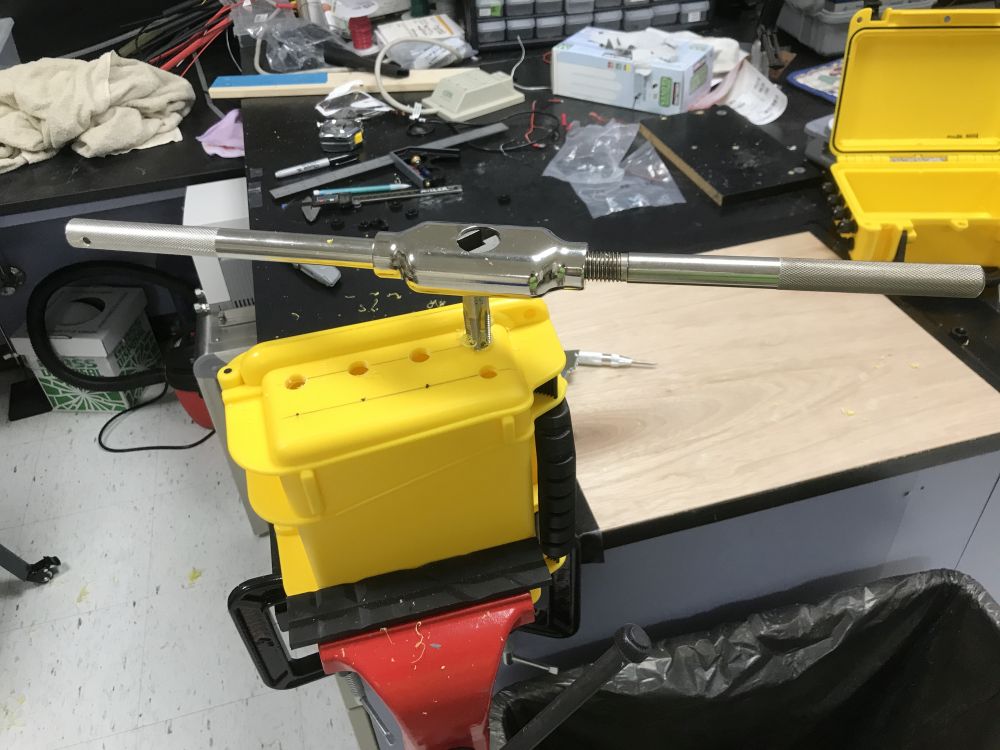
A liquid-tight bulkhead fitting (also known as a “cable gland”) is mounted for each of the separate sensor leads. These can be had for less than a dollar per piece from no-name online suppliers, or about $1.50-3.00 apiece from standard retailers. Here I’m using fittings sized for 2.5mm to 7mm diameter cable, and the fitting has a PG-7 threaded fitting for screwing into the side of the box. PG-7 is an odd size (it is a straight-thread, not tapered), but it happens to fit fine in the first few threads cut by a standard tapered 1/4″ NPT tap before the tap reaches its full diameter. There are also actual PG-7 sized taps available from various sources as well.
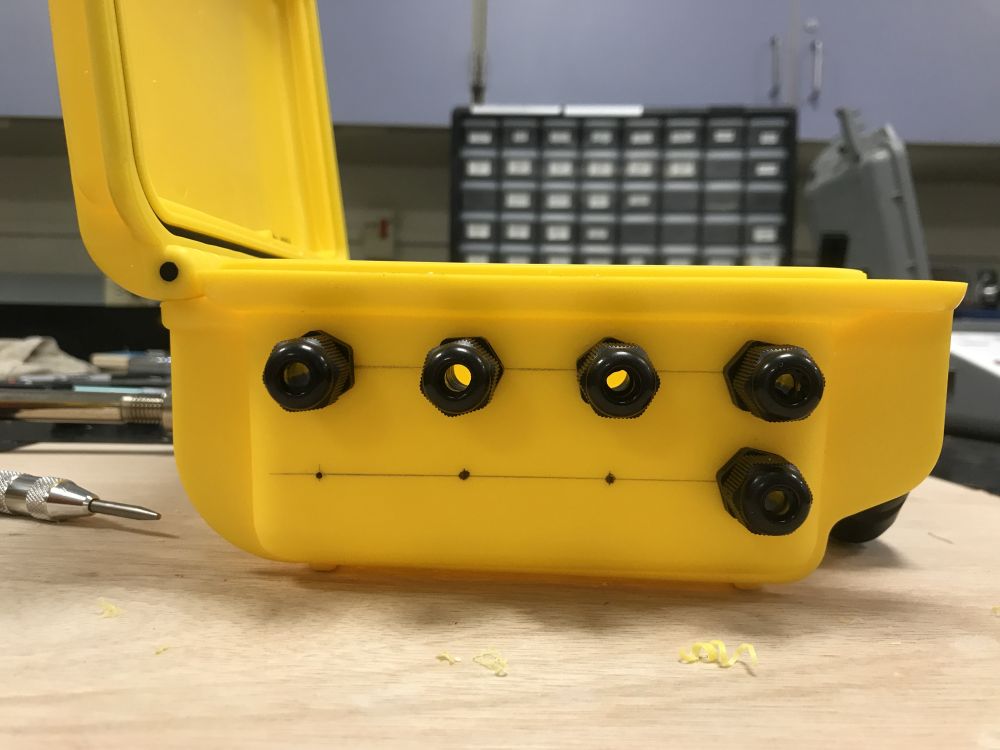
These fittings grip the cable that passes through them with a rubber seal, and do a decent job of sealing out seawater, at least when only submerged to a depth of a meter or so in the intertidal zone.
It’s usually a good idea to calibrate these things before you start collecting real data. I use a re-purposed syringe pump to move a magnet at known distances away from the Hall effect sensor encased in the end of the cable. The Hall effect sensor will be glued to one valve (shell) of the oyster, and the magnet will be glued to the other valve, so that as the oyster opens up, a voltage change is registered and recorded by the datalogger. In the video, the moving carriage holding the magnet is moving 0.3175 mm each time the syringe pump activates and rotates a half-turn.
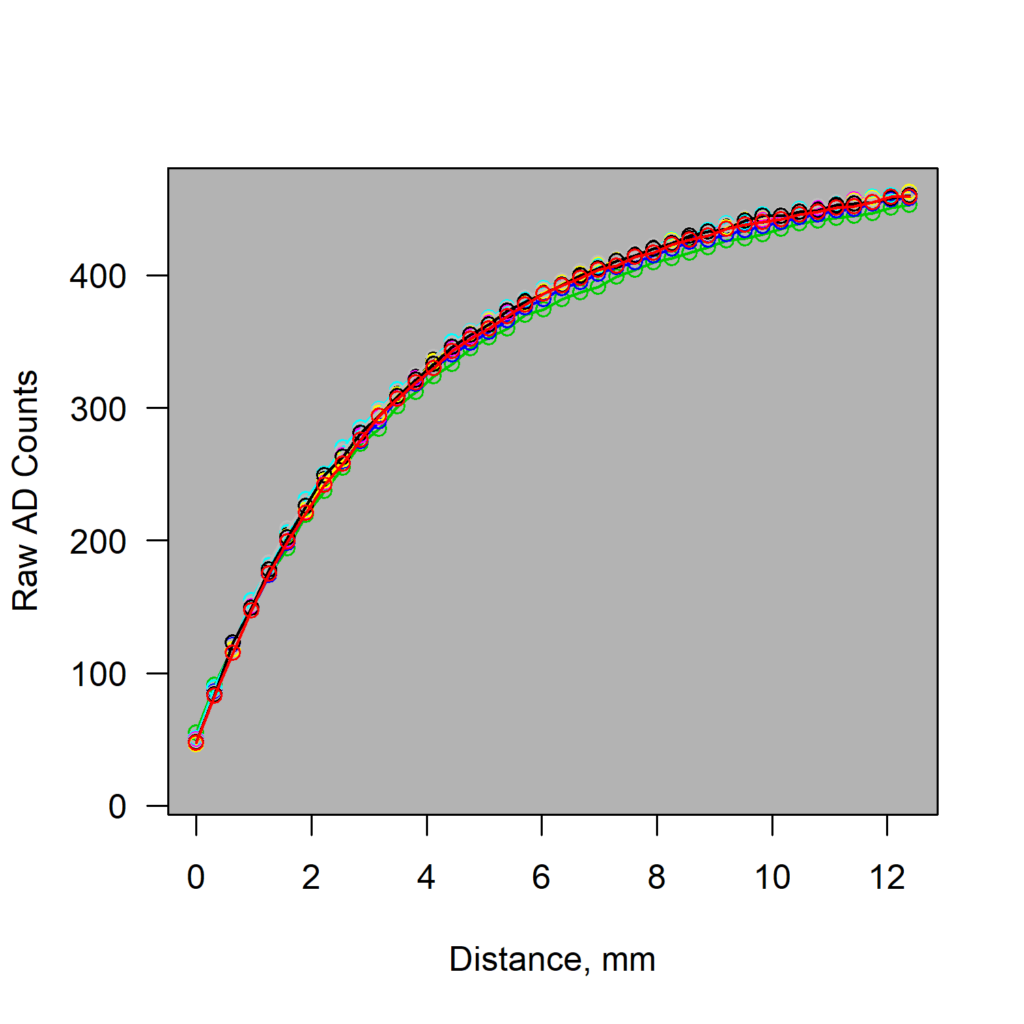
That process produces a set of curves like those shown below, from which we can derive a set of curve coefficients to be used to back-calculate approximate distance from the voltage signal recorded by the data logger.
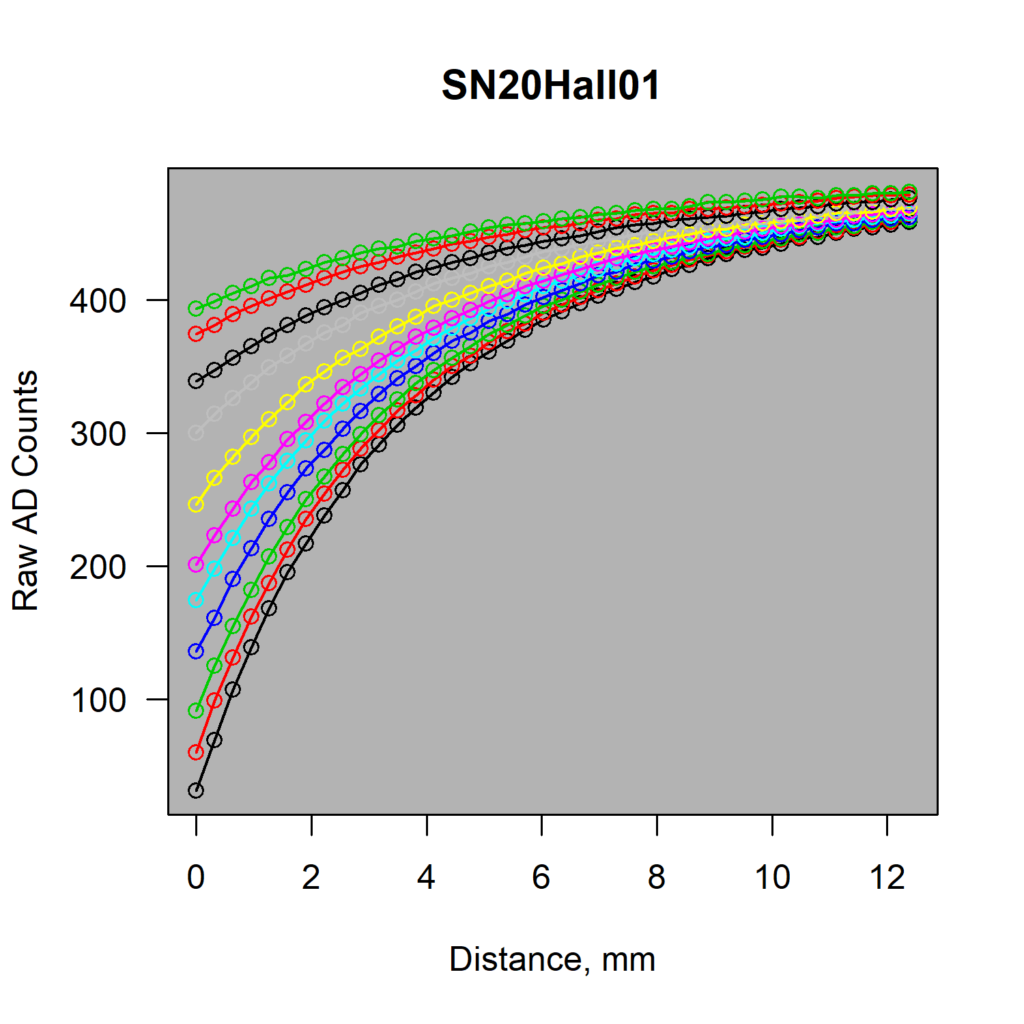
The Hall effect sensors show good repeatability, even when the angle between the sensor and the magnet is shifted slightly each time. In the image below are a set of curves generated when I altered the angle of the Hall effect sensor at the start of each trial, and then positioned the magnet to get the same starting count value from the A-D converter. Small changes of a few degrees (at most) don’t impact the shape of the response curve.
