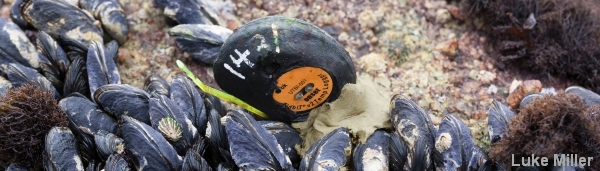
For several years, starting first at UC Santa Barbara around 1999/2000, and then in the mid 2000’s and early teens at Hopkins Marine Station, I would spend one or two low tides per year going out to the seashore and gluing fake plastic mussels into the middle of real mussel beds (as shown above). These ‘robomussels’ were originally created by Brian Helmuth (now of Northeastern University), and consisted of an Onset TidBit temperature datalogger embedded in a custom epoxy mold of an adult Mytilus californianus mussel.
A feature in the New York Times talks about the scope of the project and the motivation behind Brian’s long term study. These fake mussels would sit in among the live mussels, heating up and cooling down as the tides rose and fell, recording a temperature every 10 minutes. In the process, these biomimetic dataloggers gave us new insight into the frequency, intensity, and duration of the wild temperature swings that can happen as mussels are alternately exposed and submerged by the ocean.
Brian Helmuth had folks deploying robomussels all up and down the West Coast of North America, and eventually the method was spread to locations all over the northern and southern hemispheres. The New York Times piece accompanied our open access paper in Scientific Data (including 50+ co-authors involved in the effort over the years) describing the immense dataset and the potential uses of data from these sorts of long term monitoring projects. Ultimately, these sorts of field studies will allow us to identify potential ‘hot spots’ on the coast where organisms may be particularly impacted by the effects of climate change interacting with local-scale weather and oceanographic patterns. For instance, if you traipse through the robomussel database you can find that certain northerly locations (such as central Oregon) are frequently more thermally stressful than locations further south on the coast (such as central California) due to the particulars of the timing of low tides throughout the year. Looking just at large-scale weather patterns wouldn’t necessarily reveal this small-scale variation in temperature stress, which makes obvious the need for organism-centric environmental monitoring.
